
October 28, 2019
I’ve been using the uThing BME 680 VOC USB air quality sensor with Grafana for about 6 months now and I think I can now give a long term write up on its ease of use and accuracy/precision.
How I’m Reading:
I’ve talked a bit about its set up here. Summarized, it’s on a Raspberry Pi that’s always powered on and running a script that constantly dumps the sensor data into the online database service Grafana.
Grafana itself hasn’t given me any issues. The interface is simple enough to use and has been reliable. I also made a post about editing the GUI that was included with the basic guide here. The API is also extremely simple with its main usage being the write_points() function to pass over a json file.
I’ve also recently added a routine to the Pi that reboots it at midnight every day. A helpful guide to doing this can be found here:
http://www.henrykoch.de/en/raspberry-pi-configure-automatically-daily-restart-reboot-with-cron
I don’t know exactly why, but if I don’t reboot the Pi occasionally, VNC viewer gradually loses its ability to function. There’s probably a memory leak somewhere but doing this masks the problem.
Data Quality:
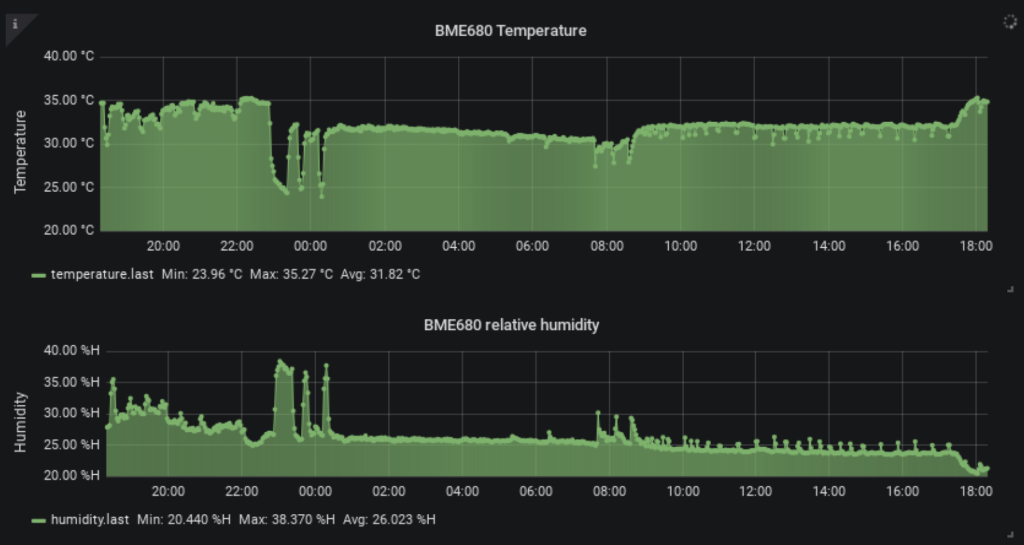
This is where things get interesting. I don’t have equipment to verify the accuracy of metrics like air pressure or gas sensor resistance which are factors in the air quality score it provides so I can’t really speak to their effectiveness. Humidity and temperature are interesting though. They both track fairly inversely of each other which matches the data seen on local weather maps, but an interesting effect of having this data graphed out is I can track how my AC system is performing throughout the day!
The air quality index that the sensor calculates internally has also been interesting. According to the datasheet, there’s a calibration process constantly running that sets the relative score to 25 being “typical good” air and 250 being “typical polluted air” based on measurement history. It usually goes up after I get home from work since it’s affected by things like cooking and exhaled breath, but I’ve noticed strange behavior around when the Pi reboots.
As the night continues, the air quality index rises (meaning air quality is going down) and peaks at around midnight. My sensor is located near my bathroom so the humidity of my shower could be causing it to increase. This doesn’t track down as humidity reduces however so I don’t know what could be causing this. Then, when the Pi reboots, the index drops back down to lower levels. This could be me erasing the previous index history on a reboot that changes its relative values and thus the internal calibration? The datasheet also mentions that it factors in up to 4 days of previous measurements to determine the index. Knowing this, it could just need a bit more time to accrue data for its relative calculations.

Summary:
In conclusion, I feel that this sensor has been mostly useful in tracking data such as temperature and humidity. Its air quality index is questionable but I haven’t compared it to a room that routinely has poor air quality. If you’re looking for a sensor to quickly get started tracking the air in a room, I’d say this is a good option!


2 Comments
Add Yours →Hi Dan,
Wow, that was a very nice write-up 🙂 Do you mind if I share it with other users who might find it interesting?
Let me add a few comments that it may be of your help:
– I’ve also found Grafana very useful, I had my setup running with InfluxDB for months in a RPi3 with no issues. Is there a special reason you use VNCViewer? I’ve also found it problematic sometimes so I usually use it for configuration only. To visualize Grafana you can directly open the Grafana IP on your browser if you are in the same network, so it will run more smoothly than over VNC. Of course your RPi and router need to allow this access, but if you have already opened the port for VNC I guess you know how to do it 🙂
– Humidity/Temperature correlation: that’s correct, there is a strong correlation, actually the calculation of relative humidity is a function of the air temperature (https://en.wikipedia.org/wiki/Relative_humidity).
– VOC index: unfortunately the calculation algorithm is proprietary from Bosch so there is no way to understand exactly how it works, they only describe vaguely the expected behavior. Regarding the IAQ returning to 25 when the RPi resets, that’s probably the case, I’m not completely sure, I’d have to try it, but I think the USB bus forces the board to reset on the process, it may cut the power for a short period too, so the baseline information for the IAQ index will be lost, will start from scratch collecting these variables.
Thanks again for your review! this kind of input encourages us to keep developing useful stuff and the users’ feedback is very valuable to improve it 🙂
PS: would you mind to leave a short review on the Tindie store sharing your experience?
Thanks! All the best, Daniel.
Thanks for leaving a comment! Feel free to share with whomever you want!
I haven’t recently tried accessing Grafana through an IP address in my desktop browser. I remember running into config restrictions for using devices in the network on my router since it’s supplied by my ISP. I got around it using VNC since it seemed to be popular and worked well enough but I’ll give it another shot!